
RESEARCH & INTELLIGENCE
The Top 100
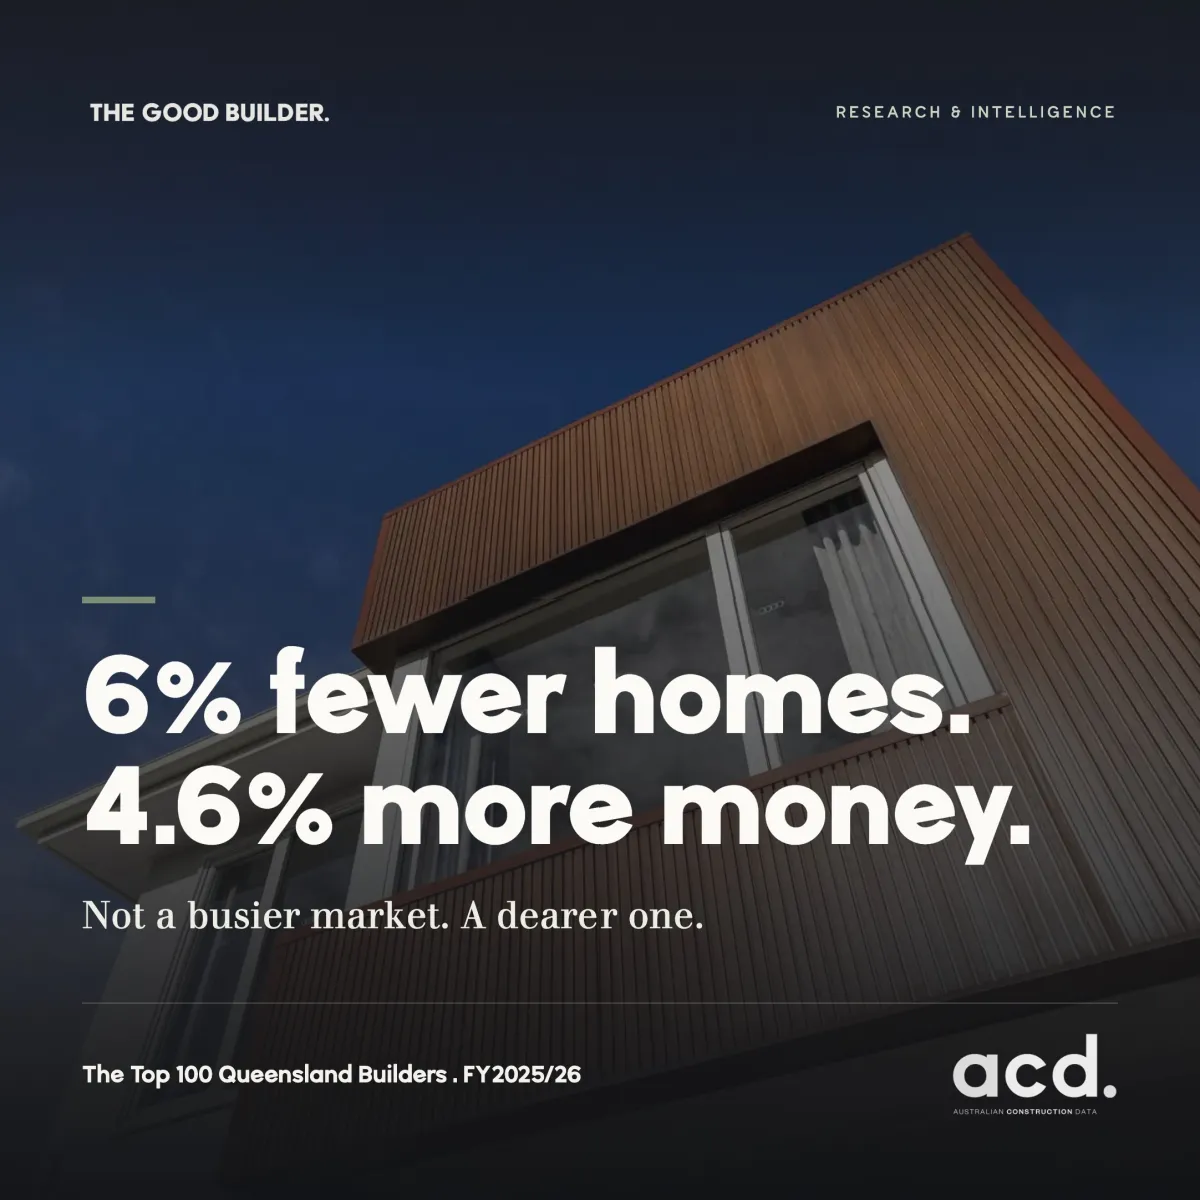
Queensland Builders
FY2025/26 INAUGURAL EDITION
Queensland's hundred biggest building businesses wrote 6% fewer new home contracts this year. And banked 4.6% more money.
THE STORY
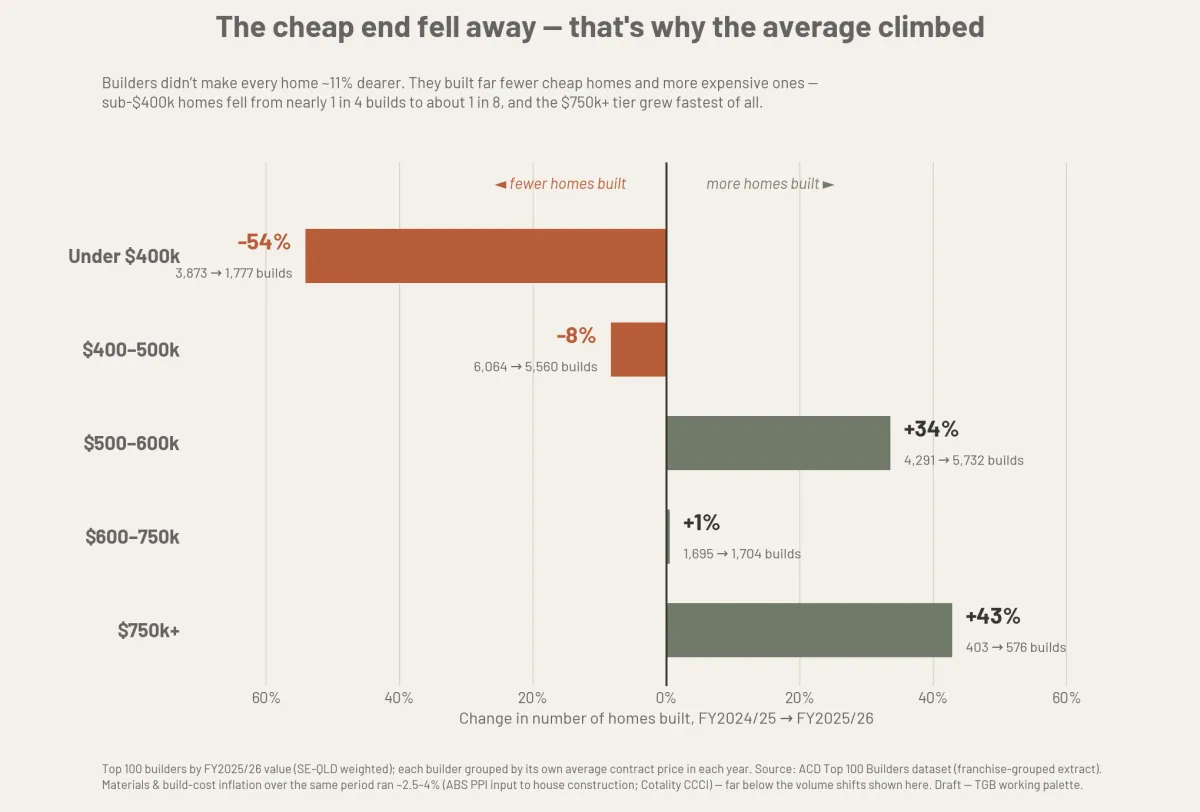
The cheap end fell away. The average climbed.
Nobody added 11% to every quote. The market moved upmarket instead.
Sub-$400k builds fell 54% in a single year. The $750k-and-above tier grew 43%, the fastest move in the market. Fewer homes under $500k, more homes above it, and the blend did the rest.
Here is the part worth paying attention to: materials did not do this. We tested the 11.3% rise in the average contract against real Australian cost data over the same window. The most generous cost-push figure is about 4%. Roughly two-thirds of the increase is product mix and pricing, not costs passed through.
If you are quoting, buying land, or supplying this market, that distinction changes your read of everything.
100
QLD BUILDERS RANKED
#1 FRANCHISE
QLD RANKED
QLD LAND
APPROVALS & COMMENCEMENTS
CONTRACT $
AVG & MOVEMENTS PER BUILDER
WHAT YOU GET
Everything behind the number, and the ranked hundred at the end.
01
The full ranked Top 100
Every builder, both years of builds, both years of value, the year-on-year move, and the FY2025/26 average contract. Franchise networks grouped as single networks for the first time, so the ranking reflects how these businesses actually operate.
02
The risers and fallers
Who grew 40% off a real base. Who dropped by half. And which “fallers” are not failing at all, just changing what they build.
03
The franchise feature
Count every licence and Queensland's biggest franchise lands in the top ten overall, and it is the only major network that grew builds in a market down 6%. The full network-by-network breakdown is inside.
04
Where the work actually is
Independent ABS data on approvals by council area. Statewide approvals rose 22.2%, the Gold Coast surged 71%, Cairns more than doubled. Then the layer most reports skip: where the registered lots are, because for a detached builder, lots are addressable market and approvals increasingly are not.
05
The pipeline read
Approvals are converting to commencements faster than they are being written. But almost all of the surge is attached dwellings. Detached houses, the Top 100's core product, moved single digits. That nuance is the difference between reading a boom and reading your boom.
WHO IT'S FOR
Built for people with money on the line
BUILDERS
See where you sit, who is moving in your price band, and whether the market that rewarded value over volume this year keeps doing it.
SUPPLIERS & TRADES
Demand is concentrating in the south-east and shifting to higher-spec homes. Know which corridors and which price tiers your next two years live in.
DEVELOPERS
The approvals map and the land map are telling two different stories. This report shows both, side by side, by council area.
WHAT WE OFFER
Our Best Selling Products
Leathered Granite
$65.00 $65.00

Calacatta
$20.00

Carrara white marble
$18.00 $20.00
METHOD & TRUST
Numbers you can defend in a meeting
The builder dataset comes from Australian Construction Data, counted on a QBCC Home Owners Warranty basis: contracts written, not press releases. Regional activity comes from official ABS approvals and QGSO land data, independent of the builder list.
Every external figure is dated and sourced. Every caveat is stated plainly, up front, including the ones that make our own numbers harder to oversell. That is the point. A ranking you can trust is worth more than a headline you cannot.

Copyright© 2026 The Good Builder - All Rights Reserved.